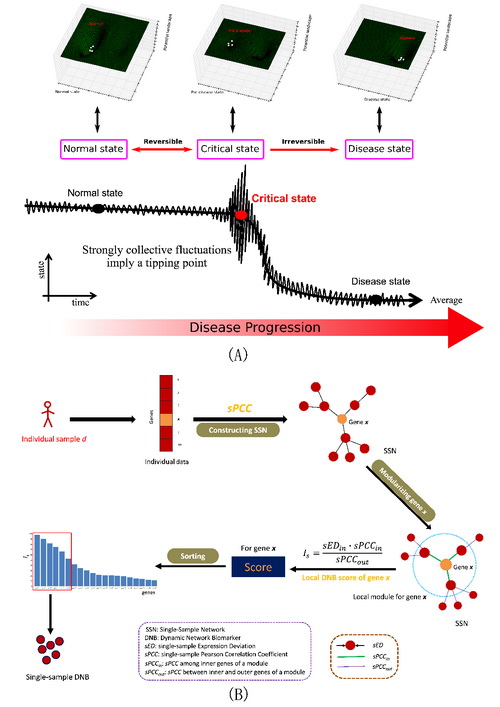
(A) Schematic diagram for disease progression of a complex disease in a subject. There are three states during disease progression comprising a normal state, a critical state (or pre-disease state or tipping point), and the final disease state. Generally, the phenotypic and molecular expressions of the disease state are significantly different from those of the normal state, but there is no significant differences observed between the critical and the normal states. Thus, detection of the critical state is difficult. However, there are strong collective fluctuations in processes at the critical state, which differs from the other states. (B) The l-DNB flowchart for identifying DNBs from a single sample. The individual data of sample d is used to construct the SSN for sample d. For every gene x, its local module is comprised of gene x and its first-order neighbors. The local module score for gene x can indicate the local DNB score for the gene. After ranking the scores for all genes, the top-k genes can be regarded as the potential DNB for the sample d. The sEDn, sPCCin and sPCCout values for each individual sample are defined in the Methods.