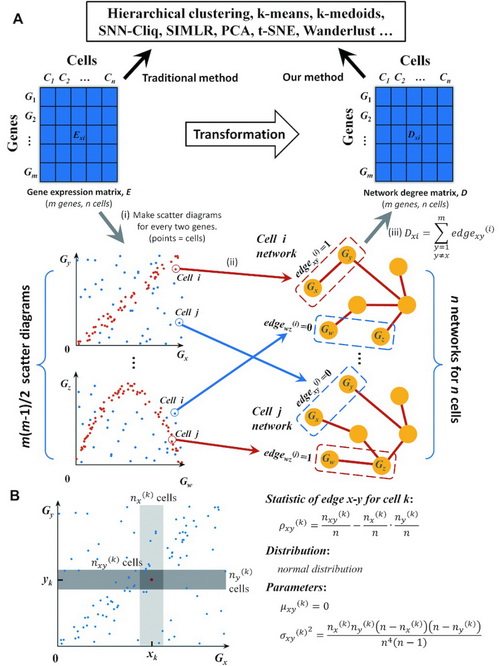
Schematic illustration of CSN and NDM construction and our statistic model. (A) CSN and NDM construction. (i) Make scatter diagrams for every two genes, where each point represents a cell, and x- and y-values are the expression values of the two genes in the n cells. Then m genes lead to m (m – 1)/2 scatter diagrams. (ii) In the scatter diagram of genes x and y, the plot i with red color means there is an edge between genes x and y in the cell i network based on our statistic model, and if the plot is blue, there is no edge. Then, we can construct n cell-specific networks corresponding to n cells, respectively. (iii) By counting the number of edges connected to each gene in each CSN, we can get the network degree matrix, which is still comprised of m rows and n columns, as the same as GEM, and thus it can be analyzed by any existing method. (B) Our statistic model for edge between genes x and y. Near the plot or cell k, make the light and medium grey boxes to represent the neighborhood of xk and yk respectively. The intersection of two boxes is the dark grey box, which represents the neighborhood of (xk, yk). The number of plots in the light, medium and dark grey boxes is nx(k), ny(k) and nxy(k) respectively. Design the statistic as ρxy(k). If x and y are independent of each other, the statistic follows normal distribution and the mean value and variance can be calculated. If the statistic ρxy(k) is larger than a significant level, label plot k with red color, which means there is an edge between x and y in cell k; otherwise there is no edge.